Climate change is a global problem, but some nations are more susceptible to its negative impacts than others. According to research, the nations most vulnerable to climate change are not the ones that produce the highest levels of carbon dioxide emissions.
MHA@GW, the online master of health administration from the Milken Institute School of Public Health at the George Washington University, created this data visualization to illuminate the dichotomy between the countries most susceptible to climate change and the countries that emit the most CO2.
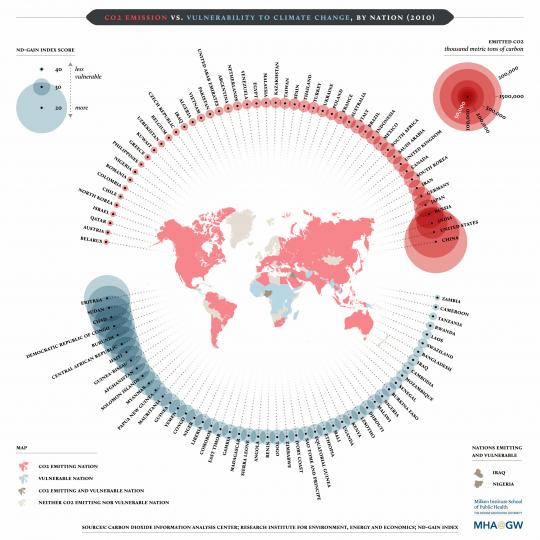
They compared data from the Notre Dame Global Adaptation Index (ND-GAIN) to data from the Carbon Dioxide Information Analysis Center (CDIAC) to develop the map. The ND-GAIN evaluates a nation’s vulnerability and readiness to adapt to climate change, and the CDIAC does a yearly measurement of each nation’s CO2 emissions.

Click on the infographic to download the high resolution version