|
Reducing Food Loss and Waste
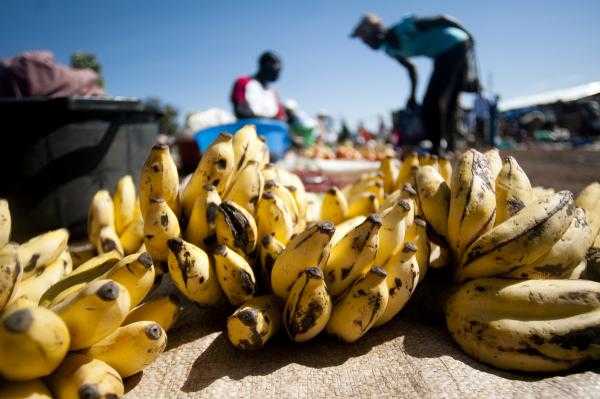
About 24 percent of all calories currently produced for human consumption are lost or wasted. This paper examines the implications of this amount of loss and waste, profiles a number of approaches for reducing it, and puts forth five recommendations for how to move forward on this issue. "Reducing Food Loss and Waste" is the second installment in the series that forms the foundation of the “World Resources Report 2013-14: Creating a Sustainable Food Future.”
The Food and Agriculture Organization of the United Nations (FAO) estimates that 32 percent of all food produced in the world was lost or wasted in 2009. This estimate is based on weight. When converted into calories, global food loss and waste amounts to approximately 24 percent of all food produced. Essentially, one out of every four food calories intended for people is not ultimately consumed by them.
Food loss and waste have many negative economic and environmental impacts. Economically, they represent a wasted investment that can reduce farmers’ incomes and increase consumers’ expenses. Environmentally, food loss and waste inflict a host of impacts, including unnecessary greenhouse gas emissions and inefficiently used water and land, which in turn can lead to diminished natural ecosystems and the services they provide.
Big inefficiencies suggest big savings opportunities. We estimate that if the current rate of food loss and waste were cut in half―from 24 percent to 12 percent―by the year 2050, the world would need about 1,314 trillion kilocalories (kcal) less food per year than it would in the business-as-usual global food requirements scenario described in The Great Balancing Act, the first installment of this World Resources Report working paper series. That savings--1,314 trillion kcal--is roughly 22 percent of the 6,000 trillion kcal per year gap between food available today and that needed in 2050. Thus, reducing food loss and waste could be one of the leading global strategies for achieving a sustainable food future.
In this paper, we profile a subset of approaches to reducing food loss and waste that experts suggest are particularly practical and cost-effective, that could be implemented relatively quickly, and that could achieve quick gains. We also recommend a number of cross-cutting strategies to further galvanize commitment to reducing food loss and waste.
Reducing Food Loss and Waste is the second in a series of working papers that we’ll roll out over the course of a year. Each subsequent paper will take a detailed look at a potential solution that could help achieve a sustainable food future. These installments will set the foundation for and culminate in the World Resources Report 2013-2014: Creating a Sustainable Food Future. To learn more about the series and sign up to receive updates, visit the World Resources Report website.
Read the report.
This blog post was originally posted here.
|
Ocean Protection Goal Increases to 30%
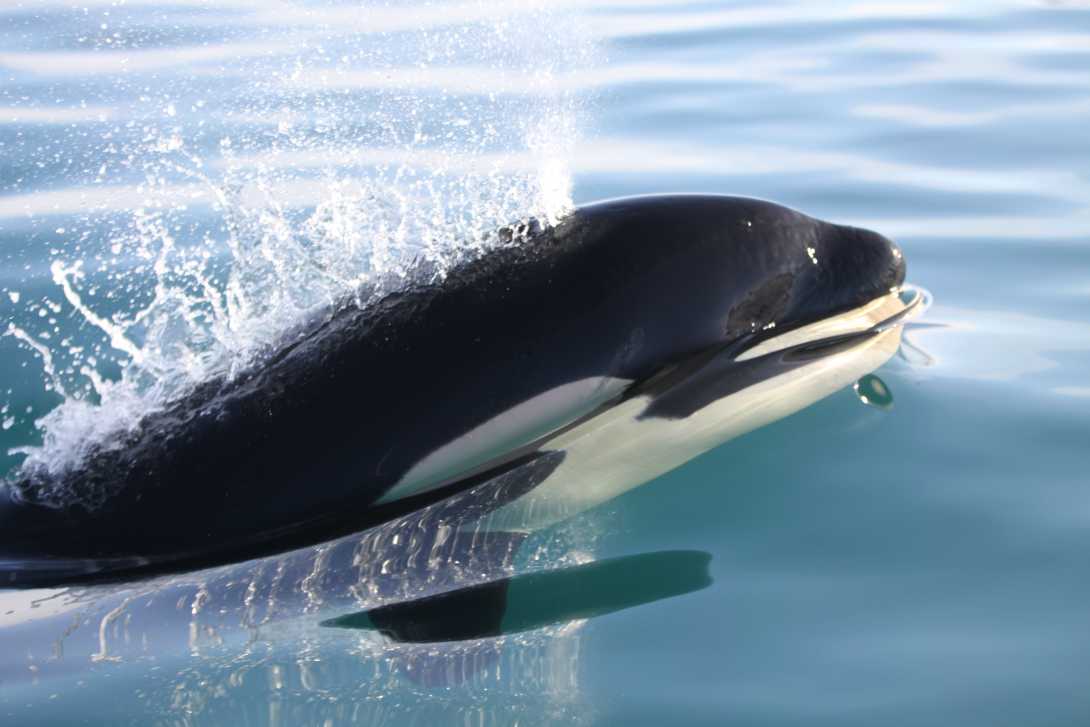
A Proud Partnership- Mission Blue Applauds IUCN’s Motion to Protect 30% of the Ocean By 2030!
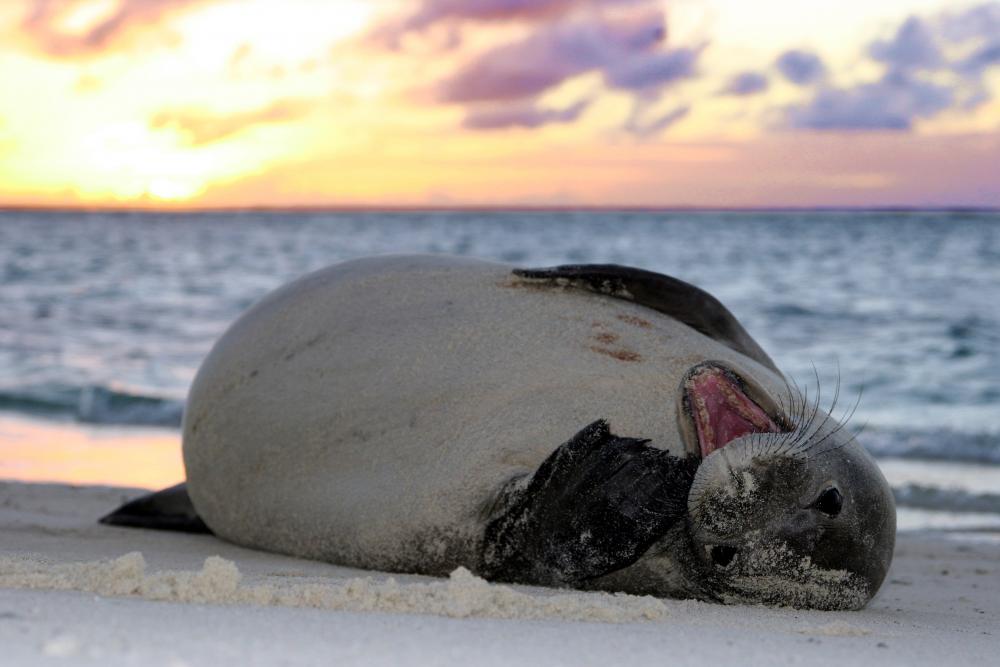
“Planet at the Crossroads” was the theme at this year’s World Conservation Congress. Organized by the International Union for the Conservation of Nature (IUCN), leaders took bold steps in confirming recommendations for 30% marine protection by 2030. Over 180 countries and 700 conservation groups were represented.
Motion 53 came one week following President Obama’s historical expansion of Papahānaumokuākea Marine National Monument. Countries are now being urged to designate this as a minimum for Marine Protected Areas (MPAs). Building fuller sustainability would include the reduction of at least 30% “extractive” activities including fishing, mining, and drilling.
Pew Charitable Trusts outlines some of the ways in which this might be accomplished:
- States committing to designate at least 30 percent of their national waters as MPAs by 2030;
- States engaging constructively in establishing MPAs in areas beyond national jurisdiction, through the development of a new global instrument under the United Nations Convention on the Law of the Sea and through the adoption of new and existing proposals at the Commission for the Conservation of Antarctic Marine Living Resources; and
- IUCN State Members calling on the CBD Secretariat to initiate the process for achieving a post-Aichi target of 30 percent of coastal and marine areas fully protected by 2030.
Warming Seas
“Ocean warming may well turn out to be the greatest hidden challenge of our generation”, indicates Dan Laffoley, Marine Vice Chair of the World Commission on Protected Areas at IUCN and Mission Blue Board Member. A new IUCN report led by Laffoley illuminates the impacts of ocean warming on ecosystems and species, and on the every-day benefits derived from the ocean- it’s ‘goods and services’. Protecting 30% of the ocean ensures resiliency to a changing climate.
The new ocean protection goal marks a celebrated achievement towards a growing movement to conserve valuable marine biodiversity. Mission Blue and countless other ocean organizations advocated for the passage of this important motion. Over the past year, citizens and organizations across the planet have nominated marine environments especially deserving of protection – known as Hope Spots – for review by Mission Blue and IUCN. After rigorous scientific vetting and policy analysis, we recently announced the names of 14 new Hope Spots, which came directly from a concerned global community calling out for more ocean protection.
By allowing citizens to elect their own Hope Spots, Mission Blue and IUCN hope to meet the 30% goal of igniting broad public support for a global network of marine protected areas large enough to protect and restore the ocean’s health.
Hope Spot nominations are open! Click here to nominate a Hope Spot.
This article was originally posted here.
|
Humanity driving 'unprecedented' marine extinction

Report comparing past mass extinction events warns that hunting and killing of ocean’s largest species will disrupt ecosystems for millions of years.
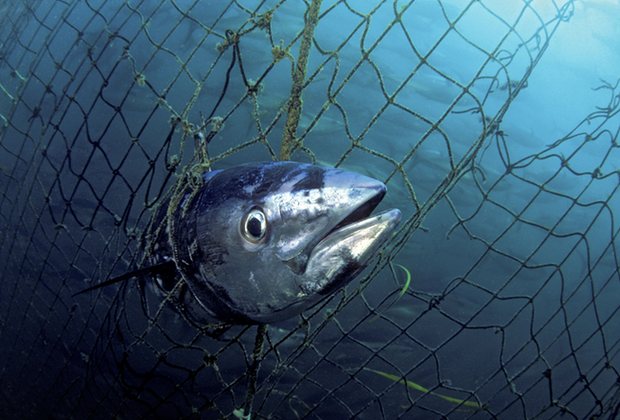
Humanity is driving an unprecedented extinction of sealife unlike any in the fossil record, hunting and killing larger species in a way that will disrupt ocean ecosystems for millions of years, scientists have found.
A new analysis of the five mass extinction events millions of years ago discovered there was either no pattern to which marine species were lost, or smaller species were the ones that disappeared.
But today’s “sixth extinction” is unique in the way that the largest species, such as great white sharks, blue whales and southern bluefin tuna, are being pushed to the brink, due to humans’ tendency to fish for larger species more often than smaller ones.
The consequences, according to a study published in the journal Science on Wednesday, are devastating for the ecology of the world’s oceans.
“If this pattern goes unchecked, the future oceans would lack many of the largest species in today’s oceans,” said Jonathan Payne, associate professor and chair of geological sciences at Stanford University. “Many large species play critical roles in ecosystems and so their extinctions could lead to ecological cascades that would influence the structure and function of future ecosystems beyond the simple fact of losing those species.”
The danger is disproportionate to the percentage of threatened species, with the authors warning the loss of giants would “disrupt ecosystems for millions of years even at levels of taxonomic loss far below those of previous mass extinctions”.
The loss of larger species in the oceans could have knock-on effects on ecosystems, Payne said, citing the loss of very large predatory seasnails (Triton) from coral reefs, which appears to be one of the reasons behind the explosive growth in numbers of crown of thorns starfish, which eat coral.
Humans would be affected by such trends too, he said, as communities rely on coral reefs to attract tourism. He also pointed to the examples of tuna and cod, whose extinction would deprive people of an important source of income and protein.
To see how the current loss of species compared to previous extinctions, Payne and his team analysed a database of 2,497 groups of marine vertebrate and mollusc over the past 500 years, and compared it to the ancient past.
They found no precedent in the fossil record for today’s trend towards killing off larger-bodied species, with previous mass extinctions marked by either no association with body size or an association with smaller species.
“The link that we found between body size and extinction threat in the modern oceans is quite strong,” Payne told the Guardian.
Co-author Noel Heim, also at Stanford, said: “We see this over and over again. Humans enter into a new ecosystem, and the largest animals are killed off first. Marine systems have been spared up to now, because until relatively recently, humans were restricted to coastal areas and didn’t have the technology to fish in the deep ocean on an industrial scale.”
Fellow author Douglas McCauley said large body size was often linked with the need for larger ocean spaces to range in, so an increasing trend for governments to create very large marine protected areas could hold some hope for species.
“Historically marine protected areas have been small boutique affairs - more like the size of golf courses. In the past five years, however, the world has begun aggressively setting up very large marine protected areas.
“Recently Obama created the world’s largest protected area in Papahānaumokuākea, a protected area just over a million square kilometres in size. This is really good news as parks of this size will indeed provide meaningful protection for large vulnerable animals we highlight as being at risk.”
This article was originally posted on the Guardian.
|
WHO releases country estimates on air pollution exposure and health impact
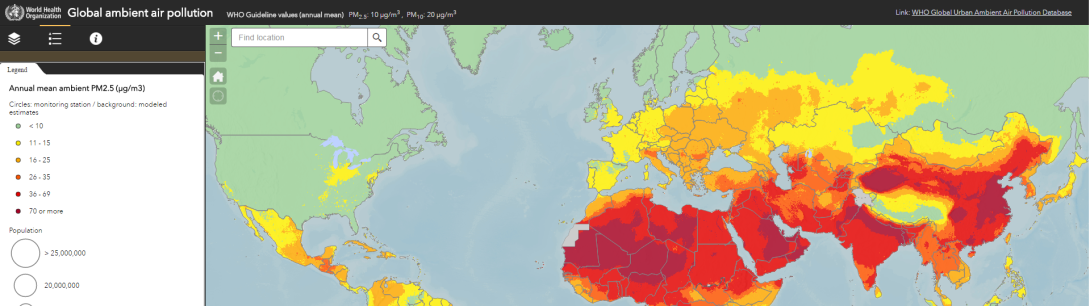
New interactive maps highlight areas within countries that exceed WHO air quality limits.
A new WHO air quality model confirms that 92% of the world’s population lives in places where air quality levels exceed WHO limits*. Information is presented via interactive maps, highlighting areas within countries that exceed WHO limits.
"The new WHO model shows countries where the air pollution danger spots are, and provides a baseline for monitoring progress in combatting it," says Dr Flavia Bustreo, Assistant Director General at WHO.
It also represents the most detailed outdoor (or ambient) air pollution-related health data, by country, ever reported by WHO. The model is based on data derived from satellite measurements, air transport models and ground station monitors for more than 3000 locations, both rural and urban. It was developed by WHO in collaboration with the University of Bath, United Kingdom.
Air pollution’s toll on human health
Some 3 million deaths a year are linked to exposure to outdoor air pollution. Indoor air pollution can be just as deadly. In 2012, an estimated 6.5 million deaths (11.6% of all global deaths) were associated with indoor and outdoor air pollution together.
Nearly 90% of air-pollution-related deaths occur in low- and middle-income countries, with nearly 2 out of 3 occurring in WHO’s South-East Asia and Western Pacific regions.
Ninety-four per cent are due to noncommunicable diseases – notably cardiovascular diseases, stroke, chronic obstructive pulmonary disease and lung cancer. Air pollution also increases the risks for acute respiratory infections.
"Air pollution continues take a toll on the health of the most vulnerable populations – women, children and the older adults," adds Dr Bustreo. "For people to be healthy, they must breathe clean air from their first breath to their last."
Major sources of air pollution include inefficient modes of transport, household fuel and waste burning, coal-fired power plants, and industrial activities. However, not all air pollution originates from human activity. For example, air quality can also be influenced by dust storms, particularly in regions close to deserts.
Improved air pollution data
The model has carefully calibrated data from satellite and ground stations to maximize reliability. National air pollution exposures were analysed against population and air pollution levels at a grid resolution of about 10 km x 10 km.
"This new model is a big step forward towards even more confident estimates of the huge global burden of more than 6 million deaths – 1 in 9 of total global deaths – from exposure to indoor and outdoor air pollution," said Dr Maria Neira, WHO Director, Department of Public Health, Environmental and Social Determinants of Health. "More and more cities are monitoring air pollution now, satellite data is more comprehensive, and we are getting better at refining the related health estimates."
Interactive maps
The interactive maps provide information on population-weighted exposure to particulate matter of an aerodynamic diameter of less than 2.5 micrometres (PM2.5) for all countries. The map also indicates data on monitoring stations for PM10 and PM2.5 values for about 3000 cities and towns.
"Fast action to tackle air pollution can’t come soon enough," adds Dr Neira. "Solutions exist with sustainable transport in cities, solid waste management, access to clean household fuels and cook-stoves, as well as renewable energies and industrial emissions reductions."
Notes for editors:
In September 2015, world leaders set a target within the Sustainable Development Goals of substantially reducing the number of deaths and illnesses from air pollution by 2030.
In May 2016, WHO approved a new "road map" for accelerated action on air pollution and its causes. The roadmap calls upon the health sector to increase monitoring of air pollution locally, assess the health impacts, and to assume a greater leadership role in national policies that affect air pollution.
* WHO Ambient Air Quality Guidelines
WHO air quality model confirms that 92% of the world’s population lives in places where air quality levels exceed “WHO’s Ambient Air quality guidelines” for annual mean of particulate matter with a diameter of less than 2.5 micrometres (PM2.5). WHO guideline limits for annual mean of PM2.5 are 10 μg/m3 annual mean.
PM2.5 includes pollutants such as sulfate, nitrates and black carbon, which penetrate deep into the lungs and in the cardiovascular system, posing the greatest risks to human health.
BreatheLife air pollution campaign
This fall WHO is rolling out BreatheLife, a global communications campaign to increase public awareness of air pollution as a major health and climate risk. BreatheLife is led by WHO in partnership with the United Nations Environment Programme (UNEP)-hosted Climate and Clean Air Coalition to Reduce Short-lived Climate Pollutants. The campaign stresses both the practical policy measures that cities can implement (such as better housing, transport, waste, and energy systems) and measures people can take as communities or individuals (for example, to stop waste burning, promote green spaces and walking/cycling) to improve our air.
Read the report
This text was originally posted here.
|
Air pollution more deadly in Africa than malnutrition or dirty water, study warns
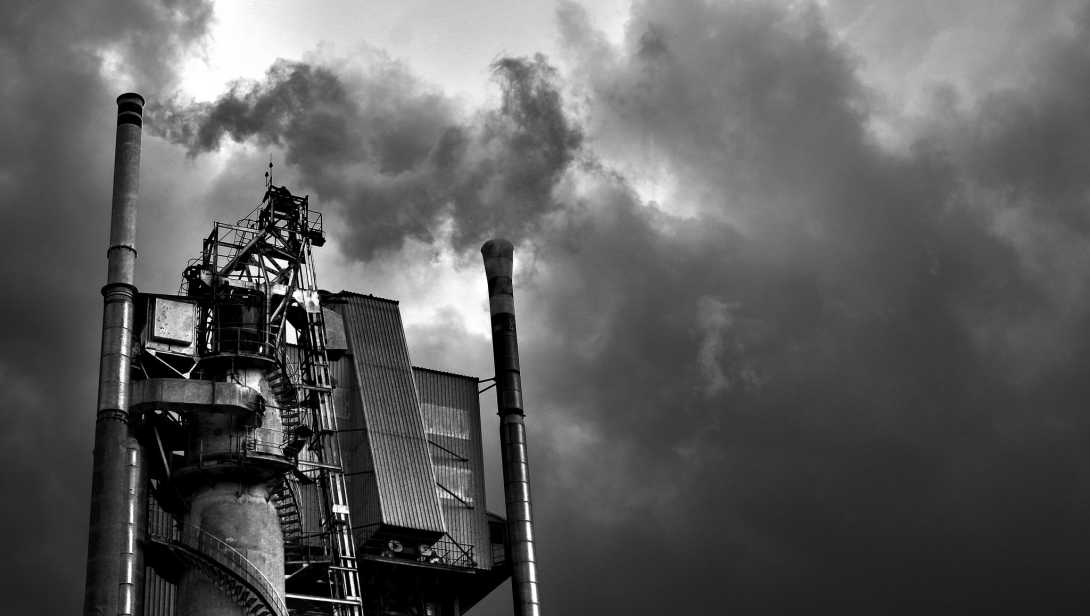
Annual human and economic cost of tainted air runs to 712,000 lost lives and £364bn, finds Organisation for Economic Co-operation and Development.
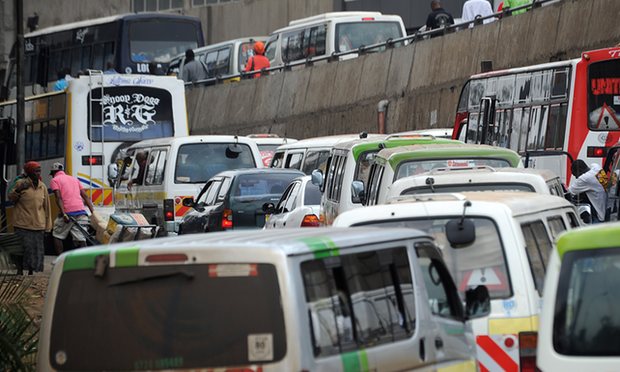
Africa’s air pollution is causing more premature deaths than unsafe water or childhood malnutrition, and could develop into a health and climate crisis reminiscent of those seen in China and India, a study by a global policy forum has found.
The first major attempt to calculate both the human and financial cost of the continent’s pollution suggests dirty air could be killing 712,000 people a year prematurely, compared with approximately 542,000 from unsafe water, 275,000 from malnutrition and 391,000 from unsafe sanitation.
While most major environmental hazards have been improving with development gains and industrialisation, outdoor (or “ambient particulate”) air pollution from traffic, power generation and industries is increasing rapidly, especially in fast-developing countries such as Egypt, South Africa, Ethiopia and Nigeria.
“Annual deaths from ambient [outdoor] particulate matter pollution across the African continent increased by 36% from 1990 to 2013. Over the same period, deaths from household air pollution also continued to increase, but only by 18%”, said a researcher at the Paris-based Organisation for Economic Co-operation and Development development centre. The OECD is funded by the world’s richest 35 countries.
For Africa as a whole, the estimated economic cost of premature air pollution deaths in 2013 was roughly $215bn (£175bn) a year for outdoor air pollution, and $232bn for household, or indoor, air pollution.
The study’s author, Rana Roy, is concerned by the pace at which outdoor air pollution is growing in Africa, bucking the downward trend in most countries. Used cars and trucks imported from rich countries are adding to urban pollution caused by household cooking on open fires.
“This mega-trend is set to continue to unfold throughout this century. It suggests that current means of transportation and energy generation in African cities are not sustainable,” said Roy. “Alternative models to those imported from industrialised economies, such as dependence on the individual automobile, are necessary.
“It is striking that air pollution costs in Africa are rising in spite of slow industrialisation, and even de-industrialisation in many countries. Should this latter trend successfully be reversed, the air pollution challenge would worsen faster, unless radically new approaches and technologies were put to use.
“The ‘new’ problem of outdoor air pollution is too large to be ignored or deferred to tomorrow’s agenda. At the same time, Africa cannot afford to ignore the ‘old’ problem of household pollution or to consider it largely solved: it is only a few high-income countries – Algeria, Egypt, Libya, Mauritius, Morocco, Seychelles and Tunisia – that can afford to view the problem of air pollution as being a problem of outdoor particulate pollution alone.”
The study stresses that there is not nearly enough knowledge of the sources of air pollution and its impact in much of Africa. It quotes UK scientist Mathew Evans, professor of atmospheric chemistry at York University, who is leading a large-scale investigation of air pollution in west Africa.
“London and Lagos have entirely different air quality problems. In cities such as London, it’s mainly due to the burning of hydrocarbons for transport. African pollution isn’t like that. There is the burning of rubbish, cooking indoors with inefficient fuel stoves, millions of steel diesel electricity generators, cars which have had the catalytic converters removed and petrochemical plants, all pushing pollutants into the air over the cities. Compounds such as sulphur dioxide, benzene and carbon monoxide, that haven’t been issues in western cities for decades, may be a significant problem in African cities. We simply don’t know.”
Whereas China has reached a level of development that has allowed it to concentrate on solving air pollution, most African countries must grapple with several major environmental burdens at the same time, said the report.
“[They] are not in the position of a China, which can today focus on air pollution undistracted by problems such as unsafe water or unsafe sanitation or childhood underweight,” said Roy.Whereas China has reached a level of development that has allowed it to concentrate on solving air pollution, most African countries must grapple with several major environmental burdens at the same time, said the report.
Henri-Bernard Solignac-Lecomte, head of the Europe, Middle east and Africa unit at the OECD development centre, said the paper made a double case for action. “Air pollution in Africa increasingly hurts people and hinders economic development. Reducing it requires urgent action by governments to change the unsustainable course of urbanisation. Indeed, Africa urbanises at a very fast pace: today’s 472 million urban dwellers will be around a billion in 2050. Today’s investment choices will have decade-long impacts on urban infrastructure and the quality of life of urbanites.
“Bold action to improve access to electricity, using clean technologies such as solar power, can contribute to reducing the exposure of the poorer families to indoor smog from coal or dung-fired cooking stoves.
“As for outdoor pollution, African economies would be well advised to learn from the experience of industrialised countries, for example by developing mass public transportation systems – like Rabat or Addis-Ababa are doing with their tramways.”
Roy warned that the human and economic costs of air pollution might “explode” without bold policy changes in Africa’s urbanisation policies.
He concluded with a call for urgent international action: “If Africa’s local air pollution is contributing to climate change today, at a time when its population stands at 1.2 billion, or 16% of the world’s population, it is safe to suppose that … it is likely to contribute considerably more when its population increases to around 2.5 billion, or 25% of the world’s population in 2050, and thence to around 4.4 billion, or 40% of the world’s population in 2100.”
This article was originally posted on the Guardian.
|
Morocco Could See 100 Percent Green Energy Use by 2050

Morocco could run on 100 percent green energy by the year 2050, according to new research on the matter from Stanford University.
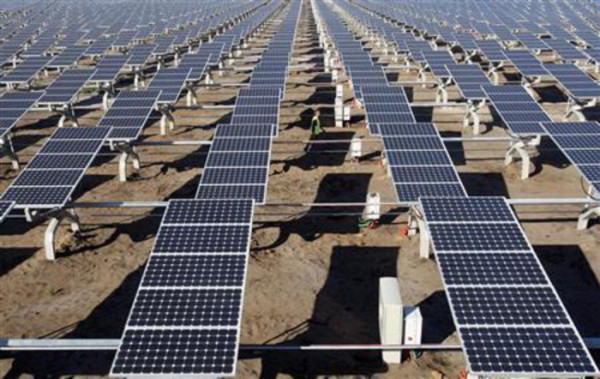
The California-based institution studied the energy prospects of 139 countries to develop a feasible and hypothetical green energy scenario for each nation.
Going green would add 88,806 permanent full-time jobs to the workforce, adding $3.53 billion to the Moroccan economy every year. Deserting fossil fuels would also save citizens from over MAD 420 billion in healthcare costs related to pollution.An optimal energy portfolio for Morocco would be composed of 65.6 percent solar energy, 29.7 percent offshore and onshore wind energy, 2.5 percent hydroelectric power and 2.1 percent additional marine energy, the California-based company’s analysis showed.
Researcher Mark Jacobson, who developed a computer model related climate change to air pollution, spearheaded the study.
The report comes as the North African kingdom prepares to host the United Nations Climate Change Summit COP22 in the tourist city of Marrakech next month. The team’s scenario aligns closely with the kingdom’s plan to become fossil fuel independent in the coming decades.
Morocco currently hosts the world’s largest solar complex, Noor 1, in the desert city of Ouarzazate, where it generates 580 MW of electricity. The National Energy Strategy calls for the development of 2000 MW of renewable energy by the year 2020 by installing new solar facilities in Beni Mathar, Foum El Oued, Boujdour and Tah Sebkhat.
Wind power’s share will increase to 14 percent to 2020, if the strategy’s implementation proceeds as scheduled. By 2030, the government plans to derive 52 percent of the nation’s energy from renewable sources.
This article was originally posted here.
|
IEA raises its five-year renewable growth forecast as 2015 marks record year

The International Energy Agency said today that it was significantly increasing its five-year growth forecast for renewables thanks to strong policy support in key countries and sharp cost reductions. Renewables have surpassed coal last year to become the largest source of installed power capacity in the world.

The latest edition of the IEA’s Medium-Term Renewable Market Report now sees renewables growing 13% more between 2015 and 2021 than it did in last year’s forecast, due mostly to stronger policy backing in the United States, China, India and Mexico. Over the forecast period, costs are expected to drop by a quarter in solar PV and 15 percent for onshore wind.
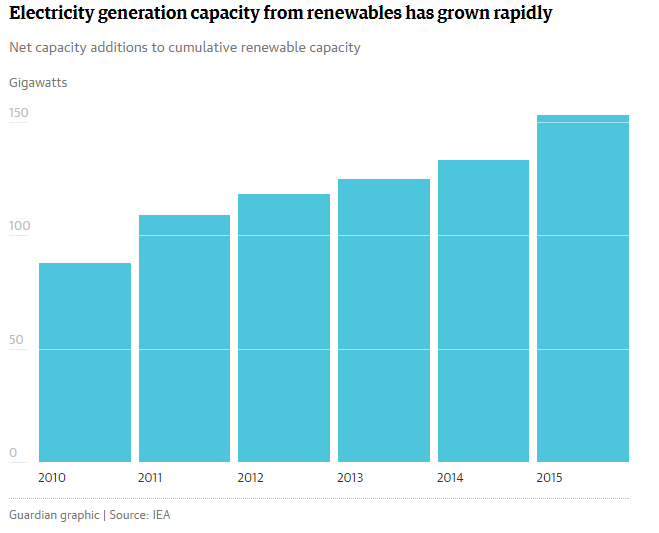
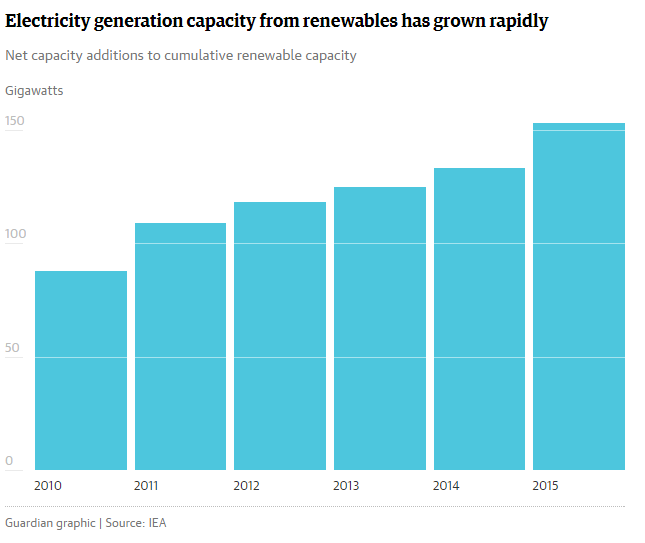
Last year marked a turning point for renewables. Led by wind and solar, renewables represented more than half the new power capacity around the world, reaching a record 153 Gigawatt (GW), 15% more than the previous year. Most of these gains were driven by record-level wind additions of 66 GW and solar PV additions of 49 GW.
About half a million solar panels were installed every day around the world last year. In China, which accounted for about half the wind additions and 40% of all renewable capacity increases, two wind turbines were installed every hour in 2015.
“We are witnessing a transformation of global power markets led by renewables and, as is the case with other fields, the center of gravity for renewable growth is moving to emerging markets,” said Dr Fatih Birol, the IEA’s executive director.
There are many factors behind this remarkable achievement: more competition, enhanced policy support in key markets, and technology improvements. While climate change mitigation is a powerful driver for renewables, it is not the only one. In many countries, cutting deadly air pollution and diversifying energy supplies to improve energy security play an equally strong role in growing low-carbon energy sources, especially in emerging Asia.
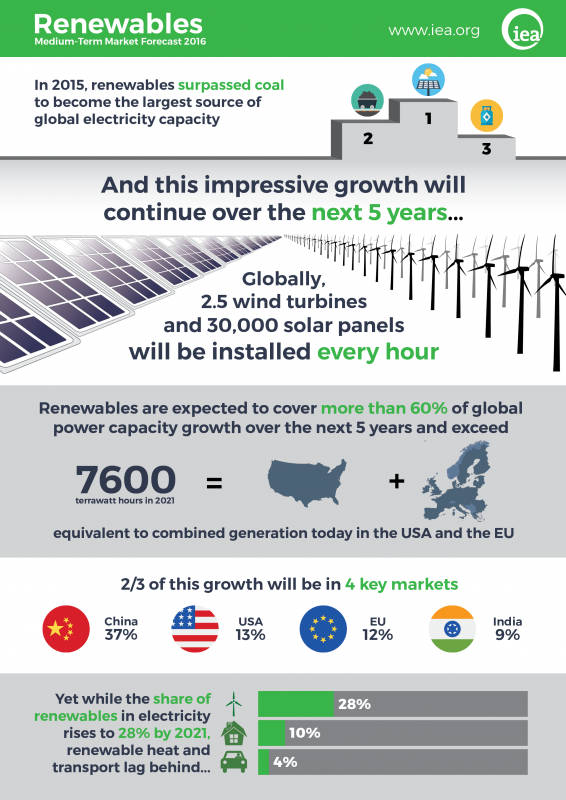
Over the next five years, renewables will remain the fastest-growing source of electricity generation, with their share growing to 28% in 2021 from 23% in 2015.
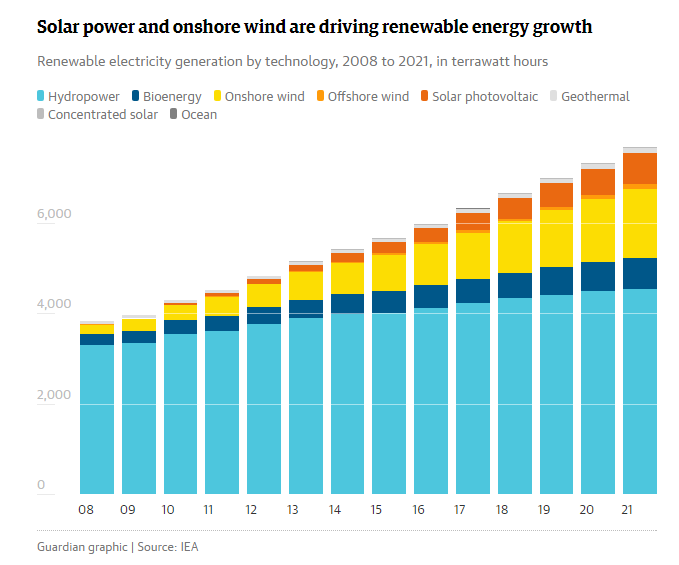
Renewables are expected to cover more than 60% of the increase in world electricity generation over the medium term, rapidly closing the gap with coal. Generation from renewables is expected to exceed 7600 TWh by 2021 -- equivalent to the total electricity generation of the United States and the European Union put together today.
But while 2015 was an exceptional year, there are still grounds for caution. Policy uncertainty persists in too many countries, slowing down the pace of investments. Rapid progress in variable renewables such as wind and solar PV is also exacerbating system integration issues in a number of markets; and the cost of financing remains a barrier in many developing countries. And finally, progress in renewable growth in the heat and transport sectors remains slow and needs significantly stronger policy efforts.
The IEA also sees a two-speed world for renewable electricity over the next five years. While Asia takes the lead in renewable growth, this only covers a portion of the region’s fast-paced rise in electricity demand. China alone is responsible for 40% of global renewable power growth, but that represents only half of the country’s electricity demand increase.
This is in sharp contrast with the European Union, Japan and the United States where additional renewable generation will outpace electricity demand growth between 2015 and 2021.
The IEA report identifies a number of policy and market frameworks that would boost renewable capacity growth by almost 30% in the next five years, leading to an annual market of around 200 GW by 2020. This accelerated growth would put the world on a firmer path to meeting long-term climate goals.
“I am pleased to see that last year was one of records for renewables and that our projections for growth over the next five years are more optimistic,” said Dr. Birol. “However, even these higher expectations remain modest compared with the huge untapped potential of renewables. The IEA will be working with governments around the world to maximize the deployment of renewables in coming years.”
View the slides from Dr Birol's launch presentation in Singapore
This blog post was originally posted here.
|
Renewables made up half of net electricity capacity added last year
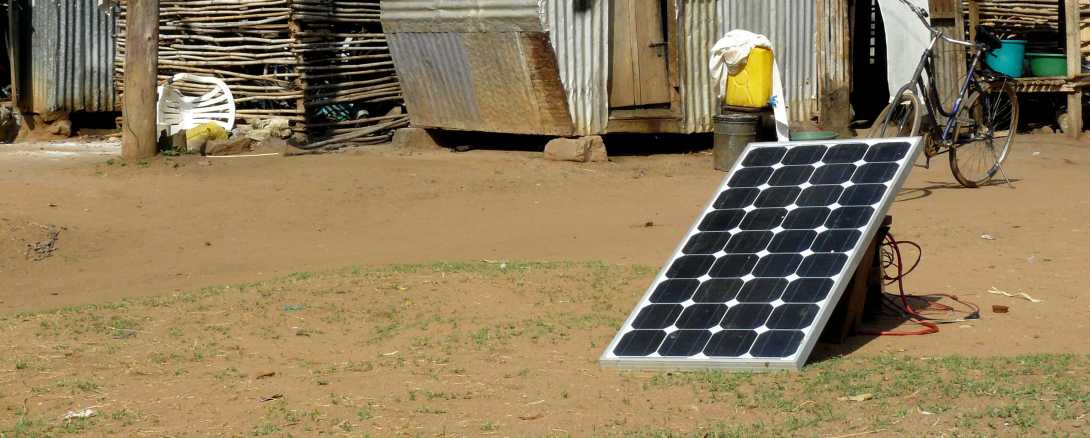
Experts hail rapid transformation that will see clean energy outgrow fossil fuels in the next five years - but warn UK is failing to exploit huge potential.
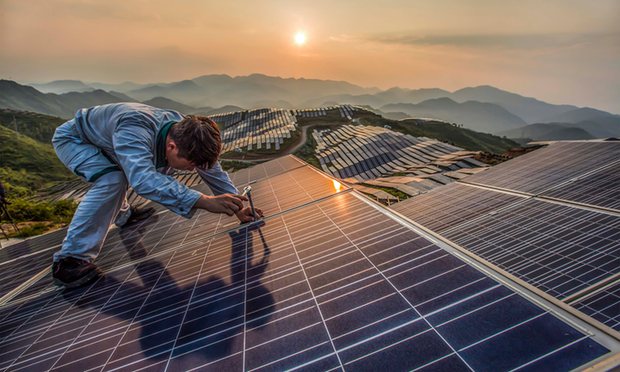
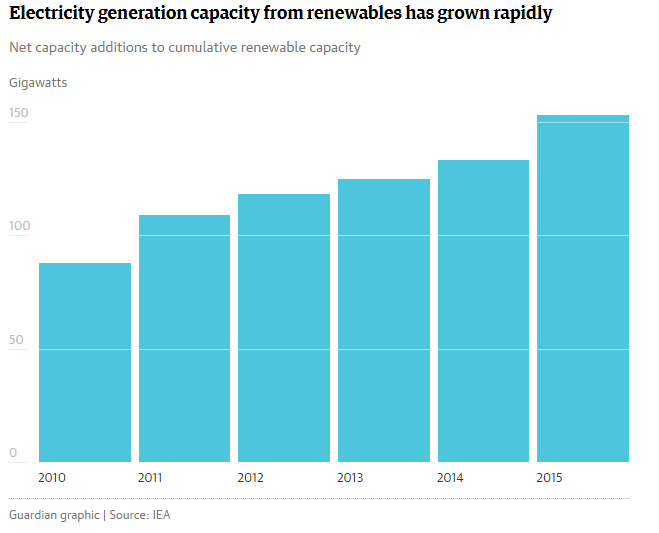
Green energy accounted for more than half of net electricity generation capacity added around the world last year for the first time, leading energy experts have found.
The International Energy Agency (IEA) said the milestone was evidence of a rapid transformation in energy taking place, and predicted capacity from renewable sources will grow faster than oil, gas, coal or nuclear power in the next five years.
But the analysts said the outlook in the UK has deteriorated since the Conservative government took power last year and cut support for wind and solarpower. The agency’s chief said Britain had huge renewable energy potential and ministers needed to design stronger policies to exploit it.
“What I see is we are witnessing the transformation of energy system markets led by renewables and this is happening very quickly,” said Dr Fatih Birol, executive director of the IEA. “This transformation and the growth of renewables is led by the emerging countries in the years to come, rather than the industrialised countries.”
China will lead the world for growth in renewable power, followed by the US and Europe, a new report by the agency found. The IEA said the EU was relinquishing its position as a renewable energy pioneer due to weak electricity demand and policy uncertainty, which Birol warned could see European renewable energy manufacturers lose out to international rivals.
“If you think of running a marathon, Europe started with a big advance, more than half of the marathon they are leading by far. They are now getting a bit tired, and some others are overtaking Europe slowly but surely,” he told the Guardian.
The IEA said Asia will be the “engine of growth”, led by China and India. “China is a completely separate chapter,” said Birol. “China alone is responsible for about 40% of growth in the next five years. When people talk about China, they think about coal, but it is changing.”
A total of 153GW of net renewable electricity capacity was installed globally in 2015, a record high, equivalent to Canada’s capacity and up 15% on the year before. Net capacity is new capacity minus retired capacity, such as old hydro being taken offline. China is expected to add a further 305GW over the next five years, followed by India with 76GW.
Onshore windfarms and solar power led the charge last year, with 63GW and 49GW of new global capacity respectively. The two technologies are also forecast to take the lion’s share of growth, with electricity generation from solar tripling and wind doubling.
Their costs are expected to continue the dramatic and unprecedented reductions in recent years, with onshore wind coming down a further 15% and big solar 25% by 2021.
“The cost of wind dropped by about one third in the last five to six years, and that of solar dropped by 80%,” said Birol, adding that while the cost of gas had also fallen recently, it was not at the same speed that green energy had become cheaper. “The decline in renewables [cost] was very sharp and in a very short period of time. This is unprecedented.”
While renewables now account for more than 50% of net capacity additions and are expected by the IEA to reach around 60% by 2021, they still provide a relatively small share of the world’s electricity. Green sources are only expected to provide 28% of electricity generation by 2021, up from 23% in 2015, and much of that will be from existing hydropower dams.
Renewable energy is seen by scores of countries as a key way to meet climate targets that they pledged under the Paris agreement, which comes into force in November.
But even with the huge growth expected in coming years, the IEA said it will not be sufficient to meet the Paris deal’s target of keeping temperatures below 2C, the threshold for dangerous warming. “No, it’s by far not enough [the trajectory of growth],” said Birol.
The agency painted a gloomy picture of solar and onshore wind’s prospects in the UK, echoing recent warnings from other respected energy authorities. “The policy landscape for renewables has become more challenging since the 2015 general election,” the report said.
Since coming to power, the Conservatives have drastically cut or ended subsidies for wind and solar power, begun the privatisation of the green bank which supports clean energy, and enthusiastically backed fracking for shale gas and new nuclear. “While government support for new gas and nuclear capacity is evident, recent policy changes indicate that the role envisioned for renewables is uncertain,” the IEA said.
“There is need in the UK to invest in stronger renewable policies,” said Birol. “The potential is huge compared to what we are expecting.”
The agency’s chief said that contrary to what renewable energy critics argued, the biggest threat to the technologies was not their intermittent nature but the intermittency of governments’ support.
“The issue is not the predictability of solar and wind, it is the predictability of government policies because investors need to see what their prospects are. This is the main challenge I see in the renewable energy sector.”
Imke Lübbeke, head of climate and energy at WWF’s European policy office, said: “The IEA report clearly shows that president [Jean-Claude] Juncker’s promise to make the EU ‘the world leader in renewables’ remains empty rhetoric. Instead, the European Union is losing its leadership role to the US and China.”