When the World Bank Group recently held its annual meeting in Washington, D.C., Italian artist Laura Canali offered up a unique vision of a warming world.
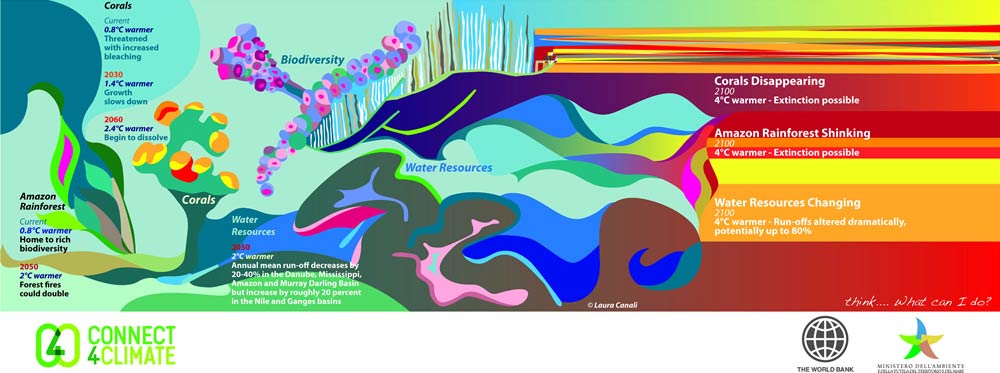
Using bold colors and fresh, unusual designs, Canali designed five maps that graphically and beautifully illustrate what she called her “interpretation of current and future climate threats to livelihoods, ecosystems, and human well-being.”
Her principal inspiration for the maps, entitled Visualising A Warming World, were the World Bank’s Turn Down The Heat reports. Richly documented and published in November 2012 and in June 2013 the reports detail the potential destructive effects of unmitigated global warming.
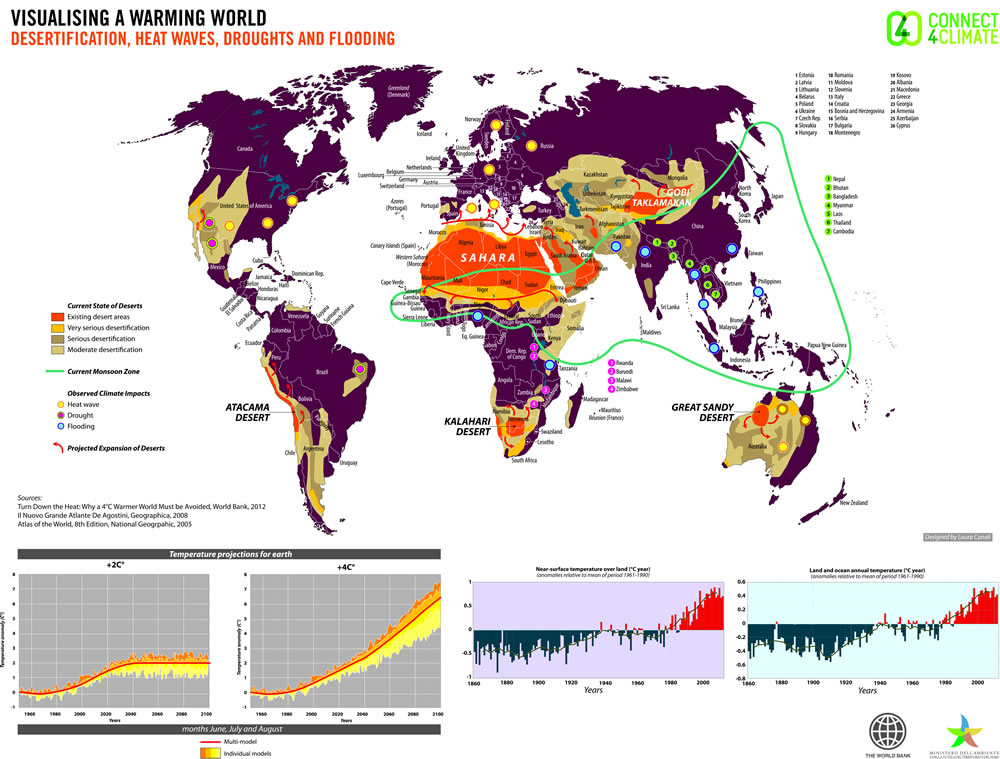
One of the maps illustrates current impacts from climate change, including heat waves, droughts, flooding and desertification around the globe. It also shows floods in Pakistan, India, China, Philippines, Thailand, Indonesia, Tanzania, and Nigeria, as well as heat waves in the United States, Europe and Australia. Canali’s map also notes future droughts appearing in Brazil and the United States, and deserts expanding from their current dimensions into peripheral areas.
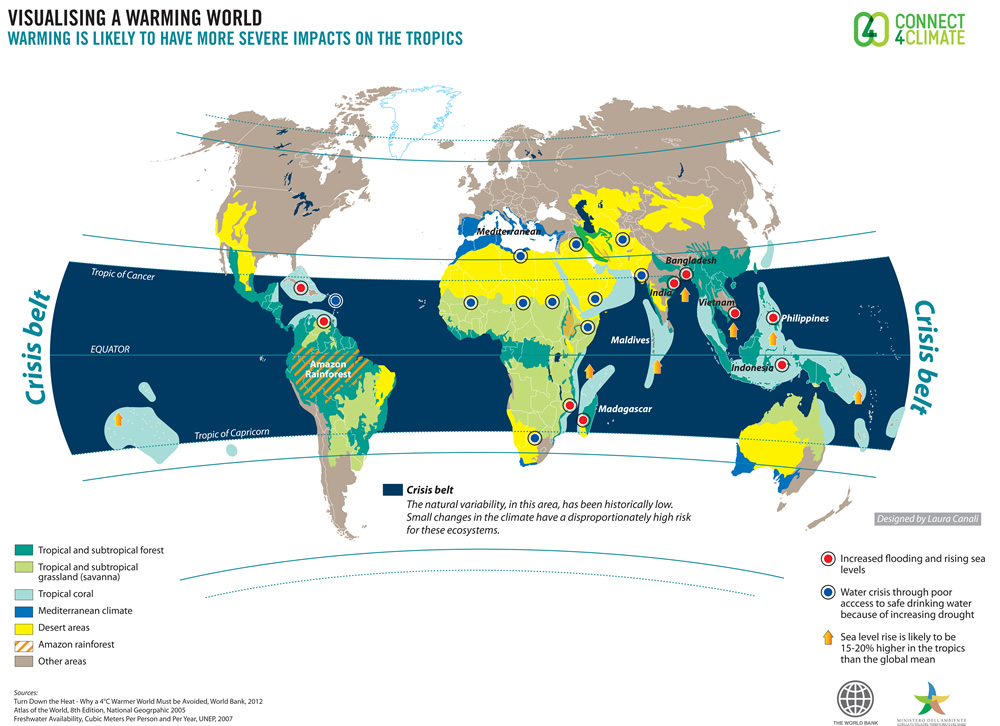
A second Canali-designed global map highlights how warming is likely to have more severe impacts in the tropics than elsewhere because natural variability in this area has been historically low. Increased flooding and rising sea levels as well as water shortages are highlighted as key threats.
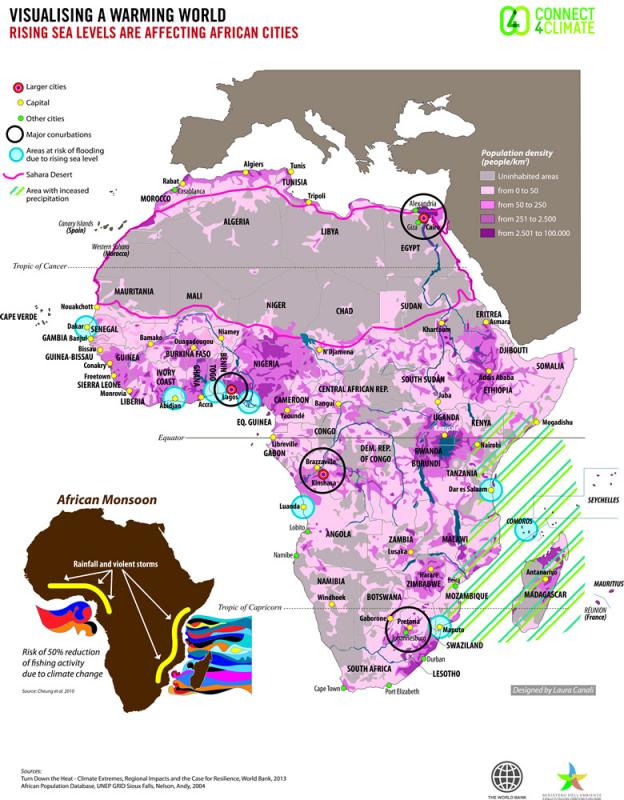
Two Africa maps show how rising sea levels are affecting African cities and how climate change is putting future food production at risk. These adverse consequences, many population experts believe, may drive large-scale population movements around and away from the continent, dislocating millions of people.
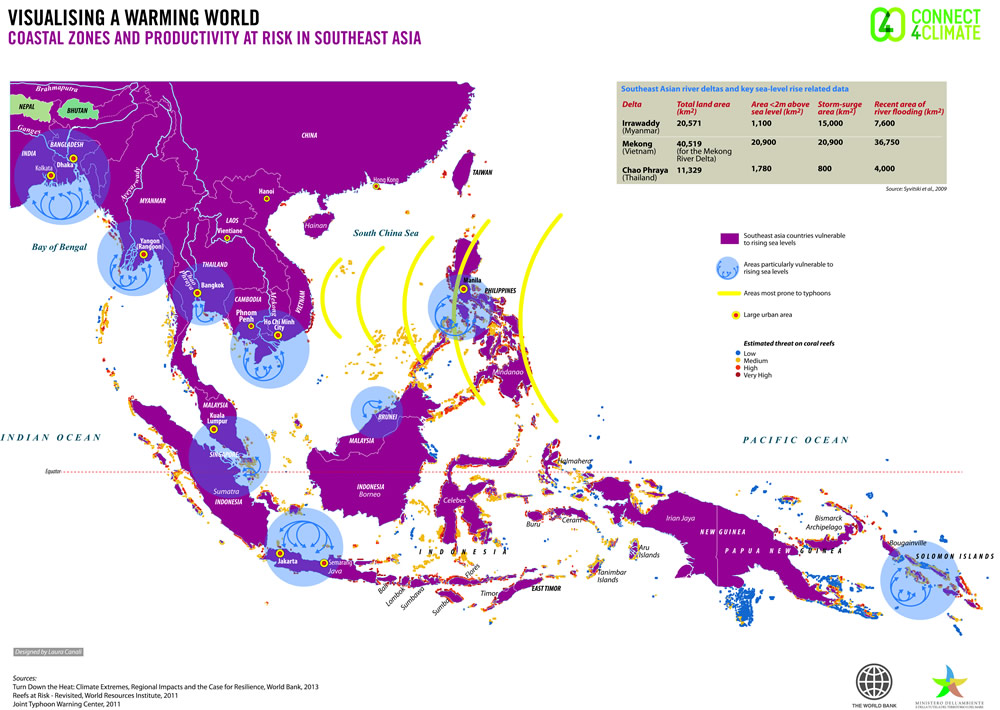
The Southeast Asia map showcases coastal vulnerabilities and how marine productivity, in particular from coral reefs, is threatened by climate change. Rising sea levels may affect large urban areas, more severe typhoons may ravage the region and coral reefs will be endangered by increasing ocean acidification and overuse.
“The goal of my maps,” Canali says, “is to help people visualize a warming world and to bring scientific knowledge about climate change to a wider audience…Drawing something that has not yet happened is a challenge. Representing scientific data calls for caution and respect for climate science, the scientists who study the evolution of our planet’s climate, and ultimately, for the audience.”
Canali’s use of color is meant to heighten the emotional impact of her maps. However, she acknowledges that ultimately it is viewers of her images who will embrace or reject the messages represented in them.
Canali hopes that through her maps people become more aware of the increasingly severe impacts of climate change and will be motivated to take action.
Climate change may be the biggest challenge of our generation and as deliberations at the World Bank’s annual meetings are demonstrating, bringing an end to extreme poverty will be impossible without tackling climate change.